
I simulate a lot of data to test my ideas, particularly the more complex ones. With non-standard stuff, it can be pretty time consuming to find the right function and/or parameters to do what I want. If the shape you want isn’t a common function or distribution, you can spend too much time searching for the right function and tuning parameters instead of focusing on the actual idea you’re exploring.
I also wanted an opportunity to experiment with AI assisted/vibe coding. Sketulate was a perfect opportunity to whip something together!
The Problem
Simulated data is invaluable for testing algorithms, validating assumptions, and prototyping quickly. But if the function or distribution you need is unusual; skewed, multimodal, jagged etc, it can be difficulty to define.
First, you have to pick something that feels “close enough”. Then adjust the parameters again and again until it looks right. Then start over if you want to try something different.
This process makes iteration slower than it should be.
The Library: Sketulate
Sketulate is a lightweight Python library that makes this process simple. Instead of fiddling with formulas and parameters, you just draw the distribution you want inside a Jupyter notebook.
- 🎨 Sketch a function or density curve on a canvas.
- ⚡ Generate a callable object from your sketch.
- 📊 Use it right away to simulate data.
It’s a quick, flexible way to get the functions and distributions you need, especially for brainstorming and experimentation.
Quick Start
Install directly from PyPI:
pip install sketulate
Then import and start sketching:
## Quick Example
from sketulate import Sketulate, SketulateInteraction

# Draw a univariate function
f1 = Sketulate()
f1.sketch()
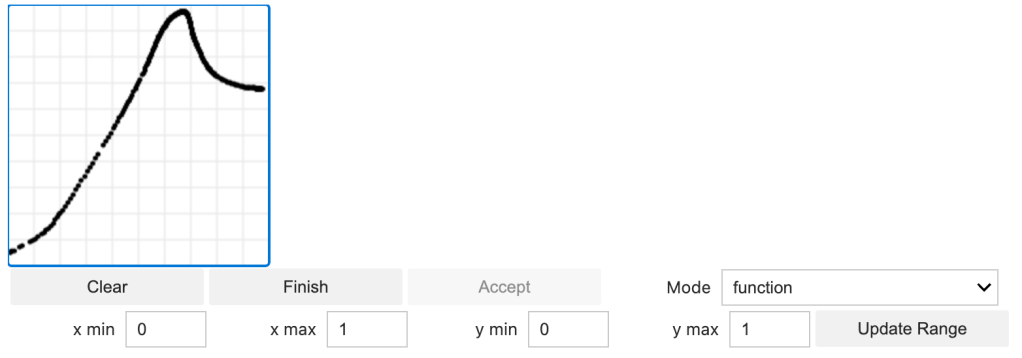
Draw your function in a Jupyter notebook cell, and you’ll immediately have a callable function. Functions come in the form of a sklearn pipeline object, so can be called with the predict function.
import numpy as np
x = np.linspace(0,1,100)
f1.f.predict(x.reshape(-1,1))
Sketch Densities
Alternatively, you can instead draw densities by changing the Mode dropdown. Sample 100 samples from a density via:
f.g(100)

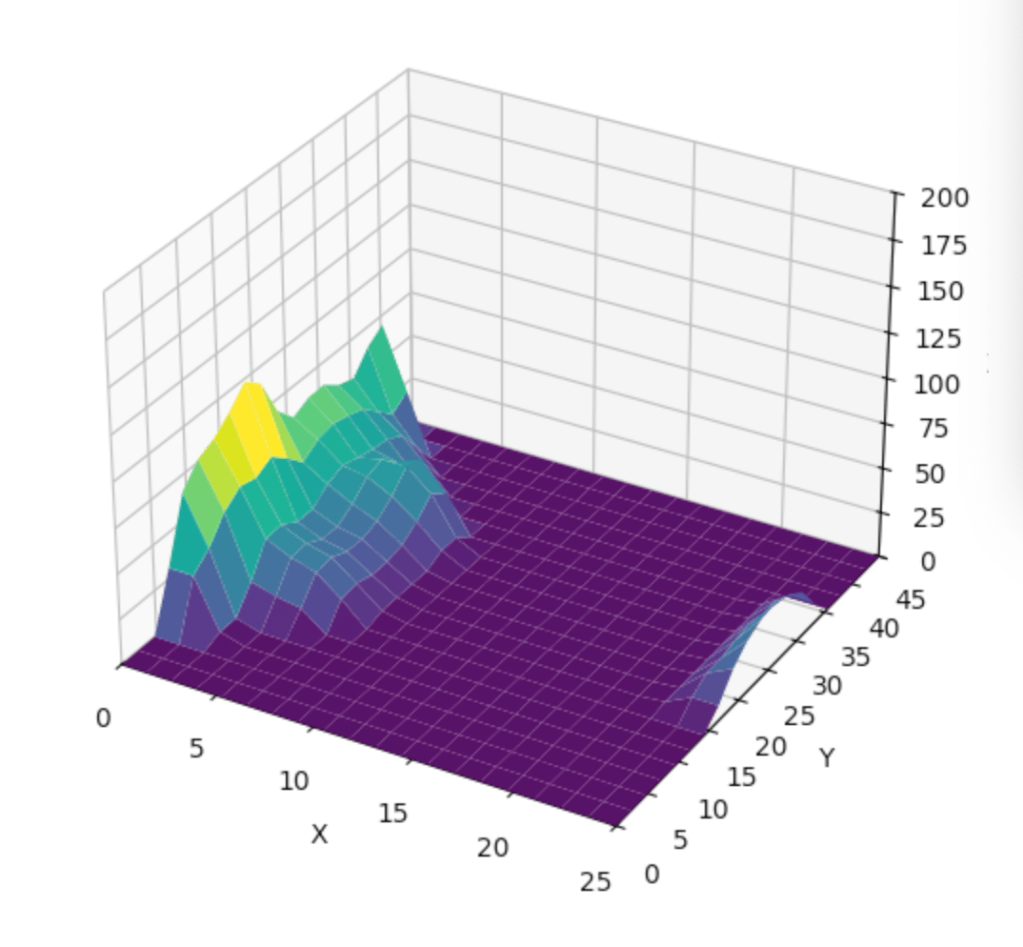
Sketch Interactions
You can also create interaction surfaces on an interactive canvas that are then converted to a function.
# Draw an interaction surface
f3 = SketulateInteraction(x_range=(0,10), y_range=(0,10), z_range=(-5,5), grid_size=5)
f3.sketch()  # Interactive surface with sliders
For examples and details, see the GitHub repo: github.com/aaron1rcl/sketulate
Why Use Sketulate?
- Faster iteration: Skip the trial-and-error of parameter tuning.
- Intuitive: Shape the data directly by sketching.
- Lightweight & simple: Minimal setup required.
- Useful for teaching & prototyping: Makes abstract concepts visual and hands-on.
Try It Out
If you often work with simulated data or just want a more intuitive way to build custom distributions, give Sketulate a try.
📦 Install: pip install sketulate
📖 Learn more: GitHub Repository

Leave a comment